SnowOnly French Ski Property Report · Winter 2026–27
What French ski homes really sell for
Completed apartment sales in all 206 French ski resorts where apartments sold, from France’s official sales register: not asking prices, not valuations. Where prices rose most since 2020, what €1m buys today, and what to check before you buy.
- 11,623completed apartment sales
- 206resorts, large and small
- 27pages, free to download
Get the free report
Download it straight away. We’ll email you the link too.
PDF, 27 pages · Sales to June 2026
Key findings
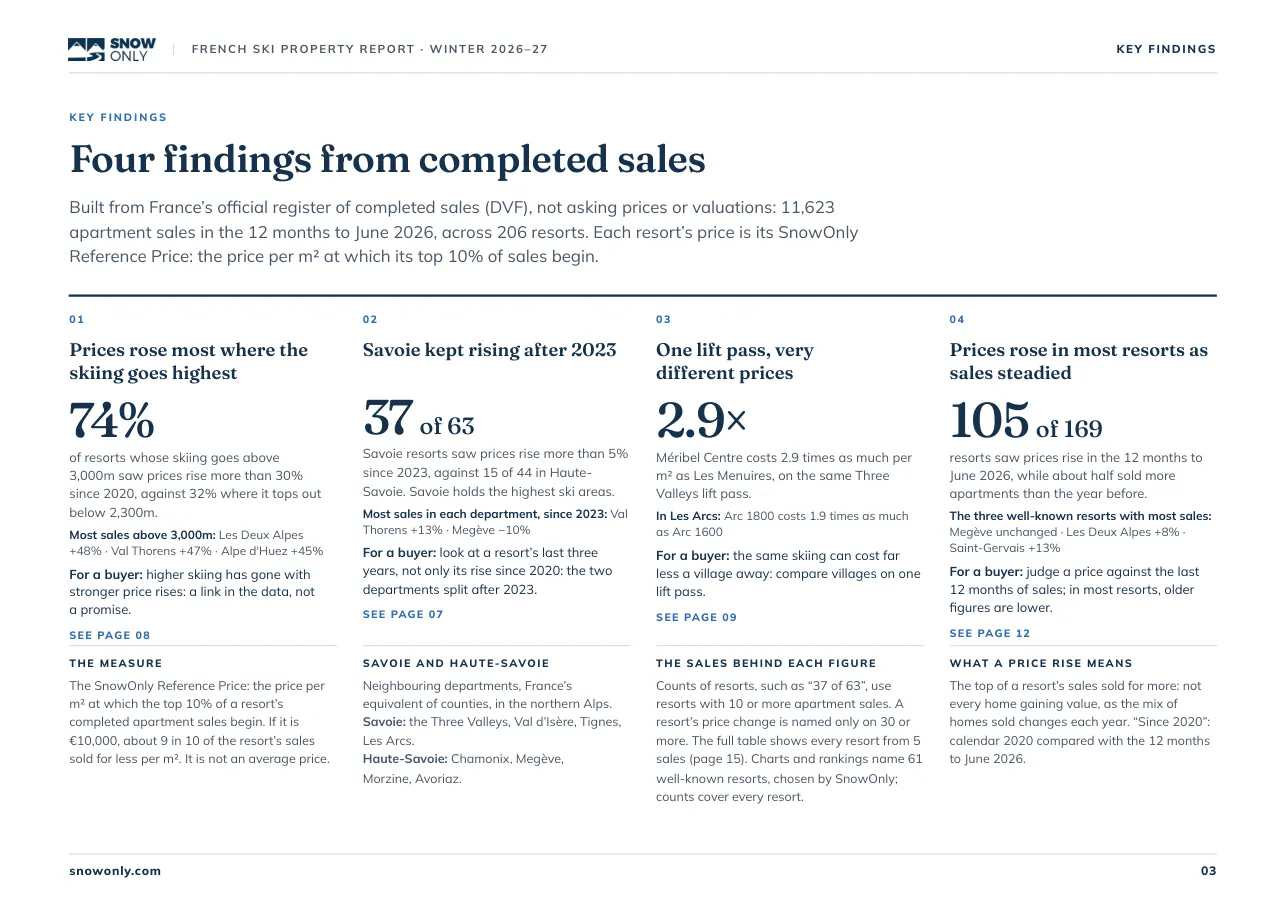
Four findings from completed sales
11,623 apartment sales in the 12 months to June 2026, across 206 resorts. The full report explains each one and names the resorts behind it.
01
Prices rose most where the skiing goes highest
74%
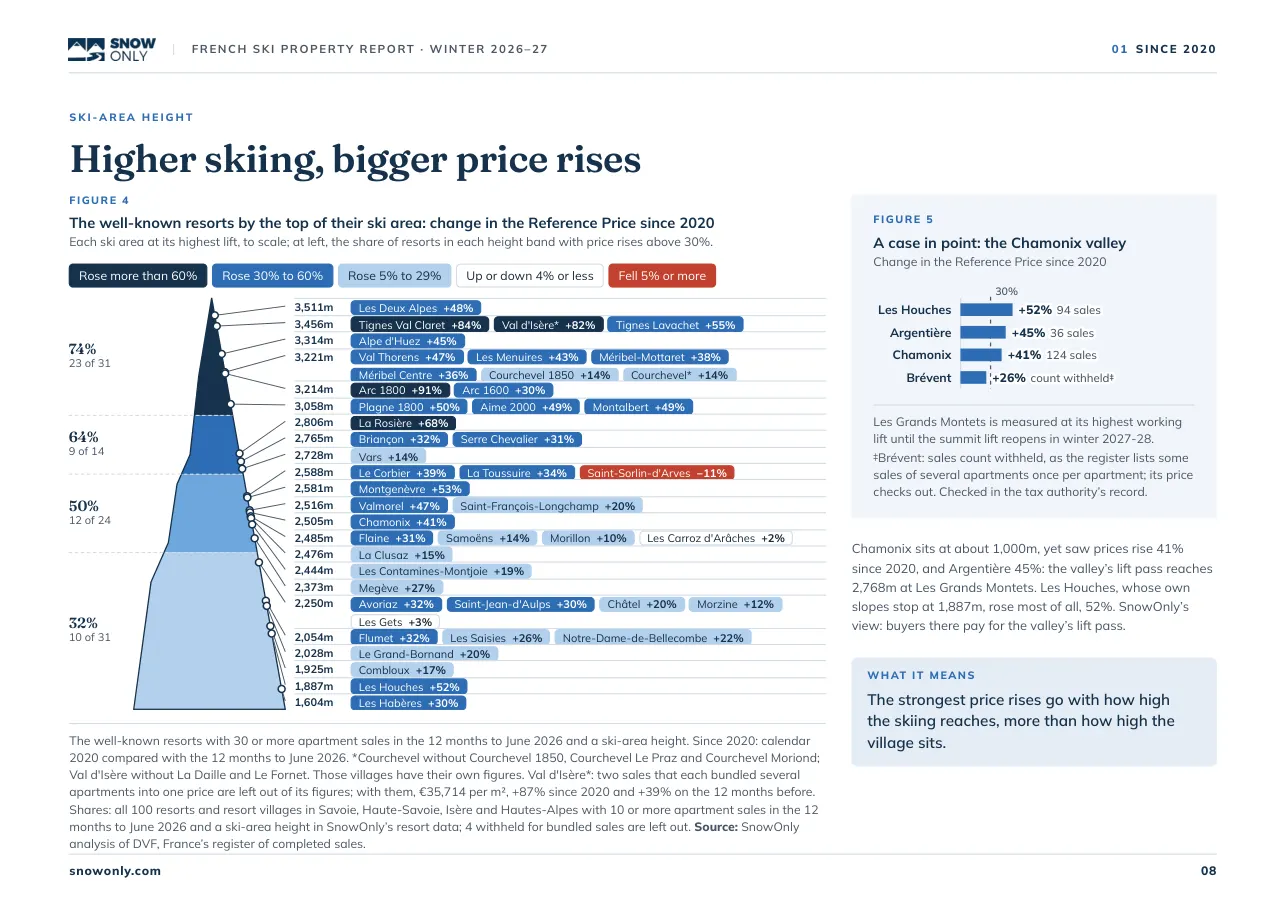
of resorts whose skiing goes above 3,000m (23 of 31) saw prices rise more than 30% since 2020, against 32% (10 of 31) where it tops out below 2,300m.
02
Savoie kept rising after 2023
37 of 63
Savoie resorts saw prices rise more than 5% since 2023, against 15 of 44 in Haute-Savoie.
03
One lift pass, very different prices
2.9×
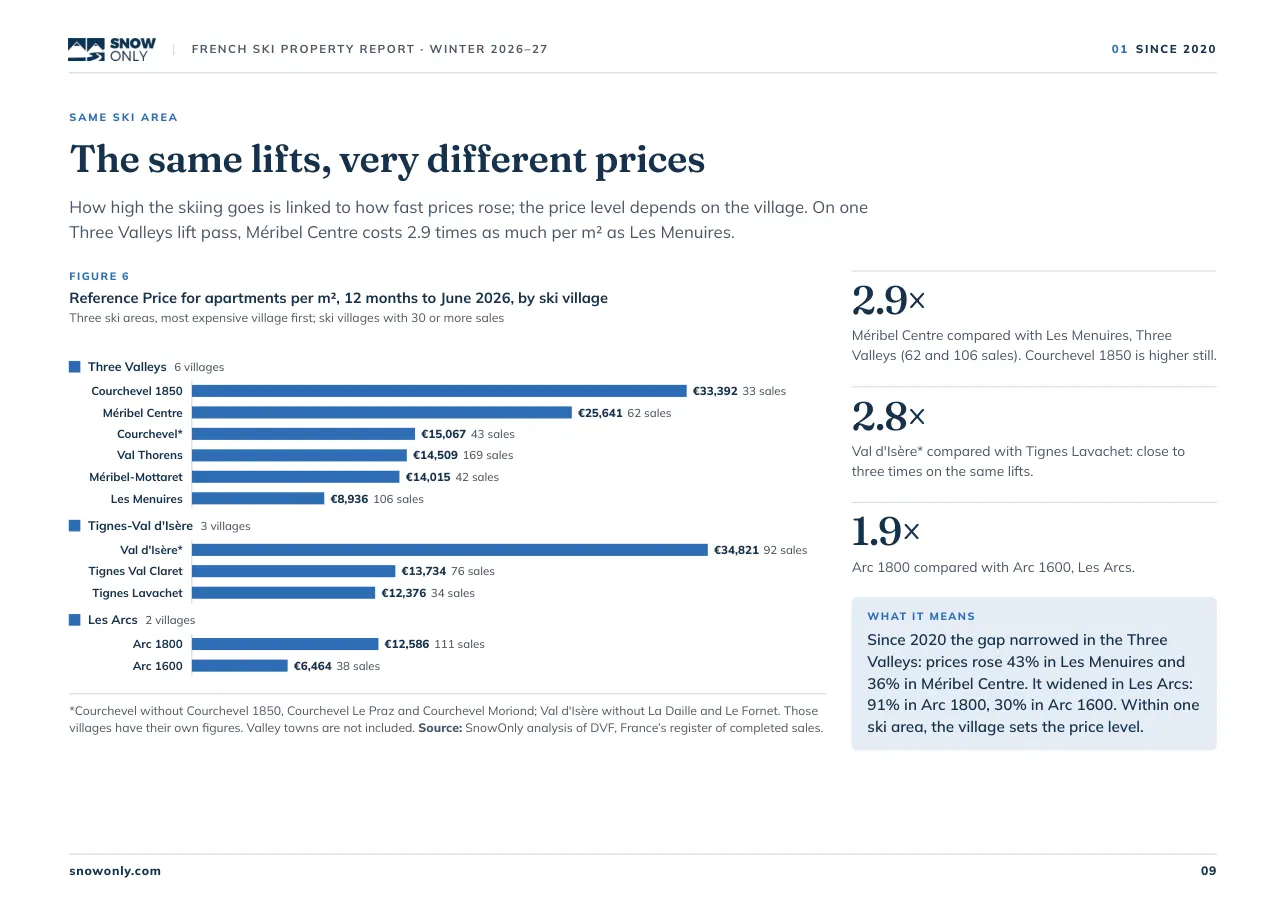
Méribel Centre (62 sales) costs 2.9 times as much per m² as Les Menuires (106 sales), on the same Three Valleys lift pass.
04
Prices rose in most resorts as sales steadied
105 of 169
resorts saw prices rise in the 12 months to June 2026, while about half sold more apartments than the year before.
The measure: SnowOnly Reference Price: the price per m² at which the top 10% of completed apartment sales in a resort begin. It marks the upper end of each resort’s sales; most homes sold for less. Comparisons use resorts with 10 or more apartment sales; a resort’s price change is named only on 30 or more.
Interactive
See the story in a few minutes
The resorts of Savoie and Haute-Savoie on a 3D map of the Alps, each pin as tall as its skiing goes. Play the story chapter by chapter, answer a few questions along the way, and open any resort’s card.
Play the storyThe lead finding
Prices rose most where the skiing goes highest
Resorts where prices rose more than 30% since 2020, by how high the ski area goes
Share of resorts in each band, with the number behind it
The 100 resorts and resort villages in Savoie, Haute-Savoie, Isère and Hautes-Alpes with 10 or more apartment sales in the 12 months to June 2026 and a known ski-area height; 4 with bundled sales left out. Since 2020: calendar 2020 compared with the 12 months to June 2026. Source: SnowOnly analysis of DVF, France’s register of completed sales.
Our figures show prices rising fastest where the skiing is highest, so buyers are still after high-altitude, snow-sure skiing. There is a growing market for dual-season resorts, and places like Morzine still stand out, but more buyers want to get up among the clouds.
Why this report is different
What buyers paid, not what sellers ask
Many ski property reports rely on asking prices or agents’ valuations. This one counts what buyers actually paid, in every resort with sales, and shows its method in full.
| This report | Other major reports | |
|---|---|---|
| Prices | What buyers paid: completed sales from France’s official register | Often asking prices or valuations |
| Method | Set out in full, with its limits | Varies by report |
| Sales behind each figure | Shown every time | Varies by report |
| Resorts | All 206 French resorts with sales | Usually a dozen or so prime resorts |
| Homes | Apartments, resort by resort | Varies by report |
Inside the report
27 pages, three chapters, every resort
Where prices rose most, what €1m buys, and the costs, taxes and letting rules to check before you buy.
-
01 · Since 2020
- Where prices rose, by ski area
- Savoie against Haute-Savoie
- Price rises by how high the skiing goes
- One lift pass, very different prices
- The most expensive resorts, year by year, and their top sales
-
02 · The 12 months to June 2026
- Where more homes sold, and where fewer
- What €1m buys: real sales near €1m, one per resort
- Top ten resorts for prices and price rises
- Price, change and sales for all 206 resorts
-
03 · What comes next
- New lifts this winter and the money behind them
- The 2030 Winter Games: venues and what stays after
-
Buying in France
- Duty, the notary’s fee and yearly taxes
- The 2024 letting law and town rules
- Energy ratings: where homes fall short of the letting grades
- Four things to check before you buy, and a checklist
Find your resort
Looking at one resort?
Every resort in the report has a live page on SnowOnly with its latest prices and sales. Search for yours.
All 206 resorts, A to Z
- Aime 2000 Savoie
- Alpe d'Huez Isère
- Ancelle Hautes-Alpes
- Aragnouet Hautes-Pyrénées
- Arc 1600 Savoie
- Arc 1800 Savoie
- Arc 1950 Savoie
- Argentière Haute-Savoie
- Auris Isère
- Aussois Savoie
- Autrans-Méaudre En Vercors Isère
- Avoriaz Haute-Savoie
- Ax-les-Thermes Ariège
- Bagnères-de-Luchon Haute-Garonne
- Barcelonnette Alpes-de-Haute-Provence
- Barèges Hautes-Pyrénées
- Beaufort Savoie
- Bellevaux-La Chèvrerie Haute-Savoie
- Bernex Haute-Savoie
- Besse-et-Saint-Anastaise Puy-de-Dôme
- Beuil-les-Launes Alpes-Maritimes
- Bisanne 1500 Savoie
- Bogève Haute-Savoie
- Bourg Saint Maurice Savoie
- Bozel Savoie
- Boëge Haute-Savoie
- Briançon Hautes-Alpes
- Brides-les-Bains Savoie
- Brévent Haute-Savoie
- Cauterets Hautes-Pyrénées
- Celliers Savoie
- Chamonix Haute-Savoie
- Champagny Savoie
- Chamrousse Isère
- Chevry Ain
- Châtel Haute-Savoie
- Combloux Haute-Savoie
- Cordon Haute-Savoie
- Cornimont Vosges
- Courchevel Savoie
- Courchevel 1850 Savoie
- Courchevel Le Praz Savoie
- Courchevel Moriond Savoie
- Crest-Voland Savoie
- Crozet Ain
- Demi-Quartier Haute-Savoie
- Domancy Haute-Savoie
- Doucy-Celliers Savoie
- Eaux-Bonnes Pyrénées-Atlantiques
- Enchastrayes Alpes-de-Haute-Provence
- Flaine Haute-Savoie
- Flumet Savoie
- Font-Romeu Pyrénées-Orientales
- Germ Hautes-Pyrénées
- Grand-Aigueblanche Savoie
- Gresse-en-Vercors Isère
- Guillestre Hautes-Alpes
- Hirmentaz Haute-Savoie
- Isola Alpes-Maritimes
- La Bresse Vosges
- La Clusaz Haute-Savoie
- La Daille Savoie
- La Faucille Ain
- La Garde Isère
- La Joue du Loup Hautes-Alpes
- La Mauselaine Vosges
- La Meije Hautes-Alpes
- La Mongie Hautes-Pyrénées
- La Morte Isère
- La Plagne Savoie
- La Rochette Savoie
- La Rosière Savoie
- La Tania Savoie
- La Toussuire Savoie
- Landry Savoie
- Lanslebourg Savoie
- Lanslevillard Savoie
- Laruns Pyrénées-Atlantiques
- Laveissière Cantal
- Le Bettex Haute-Savoie
- Le Bourg-d'Oisans Isère
- Le Corbier Savoie
- Le Fornet Savoie
- Le Grand-Bornand Haute-Savoie
- Le Monêtier-les-Bains Hautes-Alpes
- Le Pleynet Isère
- Le Tour Haute-Savoie
- Les Allues Savoie
- Les Angles Pyrénées-Orientales
- Les Bottières Savoie
- Les Carroz d'Arâches Haute-Savoie
- Les Coches Savoie
- Les Contamines-Montjoie Haute-Savoie
- Les Deux Alpes Isère
- Les Espécières Hautes-Pyrénées
- Les Gets Haute-Savoie
- Les Habères Haute-Savoie
- Les Houches Haute-Savoie
- Les Menuires Savoie
- Les Orres Hautes-Alpes
- Les Saisies Savoie
- Les Tuffes Jura
- Lugrin Haute-Savoie
- Luz-Saint-Sauveur Hautes-Pyrénées
- Lélex Ain
- Magland Haute-Savoie
- Manigod Haute-Savoie
- Megève Haute-Savoie
- Mieussy Haute-Savoie
- Mijoux Ain
- Modane Savoie
- Montalbert Savoie
- Montchavin Savoie
- Montgenèvre Hautes-Alpes
- Montriond Haute-Savoie
- Morillon Haute-Savoie
- Morzine Haute-Savoie
- Moûtiers Savoie
- Méribel Centre Savoie
- Méribel Village Savoie
- Méribel-Mottaret Savoie
- Notre-Dame-de-Bellecombe Savoie
- Noyarey Isère
- Onnion Haute-Savoie
- Orcières Hautes-Alpes
- Orelle Savoie
- Oz Isère
- Passy Haute-Savoie
- Peisey-Vallandry Savoie
- Pelvoux Hautes-Alpes
- Plagne 1800 Savoie
- Plagne Bellecôte Savoie
- Pra-Loup Alpes-de-Haute-Provence
- Pralognan-la-Vanoise Savoie
- Prapoutel Isère
- Praz de Lys Haute-Savoie
- Praz-sur-Arly Haute-Savoie
- Puy de Sancy Puy-de-Dôme
- Puy-Saint-Vincent Hautes-Alpes
- Pyrénées 2000 Pyrénées-Orientales
- Péone Alpes-Maritimes
- Reberty Savoie
- Risoul Hautes-Alpes
- Saint-Bon-Tarentaise Savoie
- Saint-Chaffrey Hautes-Alpes
- Saint-François-Longchamp Savoie
- Saint-Genis-Pouilly Ain
- Saint-Gervais Haute-Savoie
- Saint-Jean-d'Arves Savoie
- Saint-Jean-d'Aulps Haute-Savoie
- Saint-Jean-de-Maurienne Savoie
- Saint-Jean-de-Sixt Haute-Savoie
- Saint-Jeoire Haute-Savoie
- Saint-Lary-Soulan Hautes-Pyrénées
- Saint-Léger-les-Mélèzes Hautes-Alpes
- Saint-Mamet Haute-Garonne
- Saint-Martin-d'Uriage Isère
- Saint-Martin-de-Belleville Savoie
- Saint-Martin-Vésubie Alpes-Maritimes
- Saint-Michel-de-Maurienne Savoie
- Saint-Sorlin-d'Arves Savoie
- Saint-Étienne-de-Tinée Alpes-Maritimes
- Sainte-Foy-Tarentaise Savoie
- Sallanches Haute-Savoie
- Samoëns Haute-Savoie
- Sergy Ain
- Serre Chevalier Hautes-Alpes
- Servoz Haute-Savoie
- Sixt Haute-Savoie
- St Colomban des Villards Savoie
- Superdévoluy Hautes-Alpes
- Séez Savoie
- Termignon Savoie
- Thollon-les-Mémises Haute-Savoie
- Thônes Haute-Savoie
- Tignes Lavachet Savoie
- Tignes Les Boisses Savoie
- Tignes Les Brévières Savoie
- Tignes Val Claret Savoie
- Tignes-le-Lac Savoie
- Ustou Ariège
- Val d'Allos Alpes-de-Haute-Provence
- Val d'Isère Savoie
- Val Thorens Savoie
- Valberg Alpes-Maritimes
- Valdeblore Alpes-Maritimes
- Valloire Savoie
- Vallorcine Haute-Savoie
- Vallouise Hautes-Alpes
- Valmeinier Savoie
- Valmorel Savoie
- Vars Hautes-Alpes
- Vaujany Isère
- Vaulnaveys-le-Haut Isère
- Ventron Vosges
- Verchaix Haute-Savoie
- Vielle-Aure Hautes-Pyrénées
- Villard-de-Lans Isère
- Villard-de-Lans-Corrençon Isère
- Villard-Reculas Isère
- Villard-sur-Doron Savoie
- Villarodin-Bourget Savoie
- Villeneuve-la-Salle Hautes-Alpes
- Viuz-en-Sallaz Haute-Savoie
- Xonrupt-Longemer Vosges
- Échenevex Ain
No resort by that name. Try part of the name, such as “Arc” or “Courchevel”.
Using the report
Built for buyers, the press and the trade
The same figures answer different questions. Here’s where to start.
Buying a ski home
Judge an asking price against what apartments in that resort sold for, compare villages on one lift pass, and know the costs and letting rules before you make an offer.
We bring together homes from agents, developers and private sellers, and the specialists a purchase from abroad needs: finance, currency and legal advice.
Get in touch to arrange a callJournalists
Resort-by-resort figures from completed sales, each with the number of sales behind it. Mark Lightfoot, Managing Director, is available for comment.
Please cite: “Source: SnowOnly French Ski Property Report, Winter 2026–27, from DVF completed sales.” Quote the SnowOnly Reference Price as the price per m² at which a resort’s top 10% of sales begin, never as an average.
Contact the press officeAgents and developers
Quote our figures with your clients, credited to SnowOnly, and see where prices rose most, village by village.
SnowOnly lists homes from agents, developers and private sellers. Ask us about listing yours.
List your propertiesMethod and questions
Where the figures come from
Where does the data come from?
From DVF, France’s official register of completed property sales, published by the tax authority. The report counts completed apartment sales, including off-plan sales, at the price the buyer paid, in every French ski resort where apartments sold. Auctions and property swaps are left out, and so are a few sales that bundle several apartments into one price. This edition covers sales to 30 June 2026.
What is the SnowOnly Reference Price?
SnowOnly Reference Price: the price per m² at which the top 10% of completed apartment sales in a resort begin. It marks the upper end of each resort’s sales. It is not an average or the typical price: most homes in a resort sold for less.
How many sales does a figure need?
The report shows the number of sales behind every resort figure. Counts of resorts, such as “37 of 63”, use resorts with 10 or more apartment sales, and a resort’s price change is named in the text, charts and rankings only on 30 or more. The full table shows every resort from 5 sales; figures from 5 to 9 sales are marked as a rough guide, and fewer than 5 are not shown.
Why do your figures differ from other reports?
Because they measure something different. Asking prices and valuations are estimates; completed sales show what buyers actually paid, resort by resort and village by village. The report quotes other studies on their own measures, never in its charts or tables.
How often is the report published?
Twice a year, after each release of the official sales data: a Winter edition after the October release and a Summer edition after the April one. The next, Summer 2027, follows the April 2027 release. Past editions will be listed on this page.
Is the report free?
Yes. Fill in the form and you can download it straight away; we also email you the link.