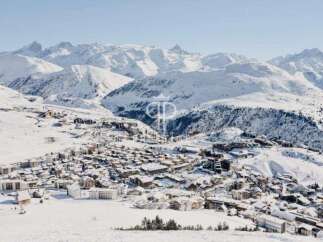
Property Market Analytics for La Morte

In 2025 the SnowOnly Reference Price in La Morte was €2,948 per square metre, 22.5% below the 2024 peak of €3,806. That peak came after four straight years of rises since the €2,686 of 2020. The 2025 fall takes the level back below the €3,039 of 2021, and leaves it 9.8% above 2020. On the 2025 figure, La Morte is among the least expensive tenth of French ski resorts.

The 16 sales in 2025 split nine apartments and seven houses, so the balance of homes sold in any one year moves the figure. La Morte is also among the quietest tenth of French ski resorts by number of sales.

The SnowOnly view: after four years of rises, one year on 16 sales took the price back to its 2021 level, so the longer run is the better guide.

You can also compare this market data for La Morte with another ski resort. Choose a resort to compare.

Key Performance Indicators

This section summarises the core numbers that define the local property market at a glance, including typical prices, how active the market is, and how values have changed over time. It helps you quickly judge affordability, demand, and longer-term price direction before diving into more detailed charts.

SnowOnly Reference Price (per m²) (2025)

€2,948

-22.5 % vs last year
Annual Transactions (2025)

16

-5.9 % vs last year
SnowOnly Reference Price (total) (2025)

€319,600

-13.5 % vs last year
5-Year Appreciation (m²)

+9.8 %

Based on Reference Price per m²

Annual Price Distribution

This chart shows the range of actual sale prices achieved each year, not asking or reservation prices. It reflects what buyers really paid when transactions completed.

How to read the lines:
  • 25th percentile: The lower end of completed sales. Around one in four properties sold at or below this price.
  • Median: The true middle of completed sales. Half sold for less, half for more.
  • 75th percentile: The upper-middle of completed sales. Only the top quarter sold above this level.
  • 90th percentile: Premium sales. Only the most expensive completed transactions reached this price.

It shows real market behaviour, helping you assess fair value, set realistic expectations, and understand where a property sits compared with what buyers actually paid.

Shows the annual sale price distribution

Price per m² Over Time

This chart shows the SnowOnly Reference Price per square metre achieved each year — the level the top tenth of completed sales reached or exceeded (not asking prices). Because it's measured per square metre, it helps you compare across different property sizes. Use it to spot the longer-term direction of the upper market, and to sense-check whether a quoted price per square metre for a premium property looks high or low versus recent years.

SnowOnly Reference Price per square metre (P90) for each year.

Transaction Filters

This chart shows the number of completed property sales by month, based on the filters you've selected such as property type, size, and time period. It helps you understand how active the market is, spot seasonal patterns, and judge how competitive conditions may be when buying and negotiating.

Monthly Property Transactions (Last 12 Months)

Detailed Breakdowns

These charts break the market down by size, room count , and property type to show how prices and supply differ across common buyer choices. They help you compare like-for-like properties, understand what drives price differences, and narrow your search to options that best match your budget and requirements.
Price by Property Size (€/m²)

Shows price by property size

Reference Price by Room Count

SnowOnly Reference Price (top 10% of sales) for each room count

Property Type Distribution

Shows property type distribution

Recent Transactions

This table shows a list of 10 recent completed property sales, including size, room count, total price, and price per square meter. It helps you see real-world prices for comparable properties, making it easier to judge value, assess asking prices, and negotiate with confidence.

Date Type Address Nom Commune Size Rooms Total Price
Apr 2026 Apartment Che Du Pre De La Grange La Morte 34m² 2 €110,000
Apr 2026 Apartment All Des Alpages La Morte 44m² 3 €200,000
Apr 2026 House Lot De L Oreille Du Loup La Morte 98m² 5 €350,000
Apr 2026 House All De La Grande Reine La Morte 46m² 2 €157,950
Mar 2026 House Imp De L Oche Sinard 87m² 4 €233,000
Mar 2026 Apartment Rte De La Mure La Morte 31m² 2 €63,000
Feb 2026 Apartment Rte De La Mure La Morte 28m² 1 €58,900
Jan 2026 Apartment All De La Grande Reine La Morte 26m² 1 €45,800
Jan 2026 House Imp De L Oree Des Pres Sinard 120m² 4 €337,500
Oct 2025 House Pl De L Eglise Sinard 100m² 5 €104,811

Transaction dates shown reflect contract signing dates from French government data. Actual property completions typically occur 4–8 weeks later.