France Property Market Data and Resort Comparison
These figures come from completed sales in France’s official register of property sales (DVF), so they show what buyers paid, not asking prices. Compare resorts here, then open any resort for its full market data.
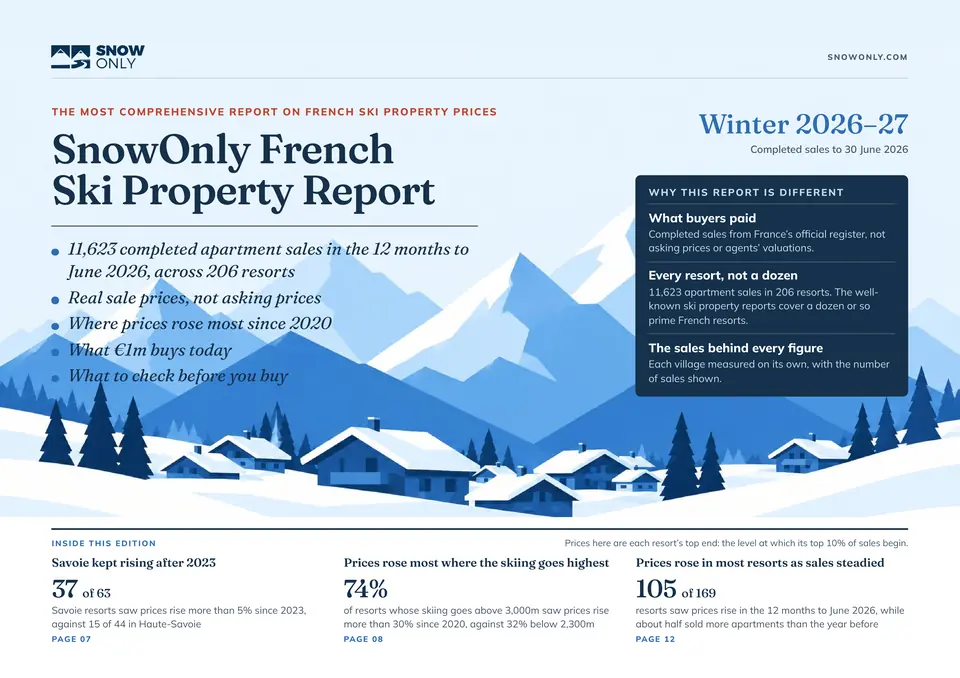
New: the French Ski Property Report
Our free report covers every completed apartment sale in France’s ski resorts, from the official sales register, and names the resorts and villages behind each finding.
- Where prices rose most since 2020, and how that tracks the height of the skiing
- What €1m buys: real sales, one per resort
- Duty, notary fees, yearly taxes and the 2024 letting rules
France Market Rankings
Resorts ranked on price per m², five-year change and number of sales, from completed sales in 2025.
Best-Known Resorts, by Reference Price per m²
2025 completed salesSwipe the table to see all market indicators.
| Rank | Resort | €/m² SnowOnly Reference Price | 5-Year Change 2020–2025 | Completed Sales 2025 |
|---|---|---|---|---|
| 1 | Courchevel - Courchevel 1850 | €34,885 | +21% | 40 |
| 2 | Val d'isere | €28,761 | +49% | 91 |
| 3 | Meribel - Méribel Centre (1450) | €25,525 | +34% | 70 |
| 4 | Megeve | €18,959 | +39% | 241 |
| 5 | Tignes - Tignes Le Lac | €15,941 | +59% | 28 |
| 6 | Chamonix | €15,214 | +40% | 182 |
| 7 | Val Thorens | €14,093 | +45% | 196 |
| 8 | Les Arcs - Arc 1800 | €12,458 | +88% | 117 |
| 9 | Alpe d'Huez | €11,499 | +44% | 220 |
| 10 | Morzine | €10,390 | +11% | 161 |
Top 10 – 5-Year Appreciation
2025 completed salesSwipe the table to see all market indicators.
| Rank | Resort | €/m² SnowOnly Reference Price | 5-Year Change 2020–2025 | Completed Sales 2025 |
|---|---|---|---|---|
| 1 | Saint-michel-de-maurienne | €3,917 | +118% | 27 |
| 2 | La Rosiere | €12,015 | +106% | 50 |
| 3 | St Martin De Belleville | €16,302 | +93% | 20 |
| 4 | Les Arcs - Arc 1800 | €12,458 | +88% | 117 |
| 5 | Peisey-Vallandry | €9,221 | +86% | 42 |
| 6 | La Toussuire | €7,000 | +85% | 84 |
| 7 | Onnion | €7,082 | +78% | 27 |
| 8 | Orelle | €4,452 | +75% | 28 |
| 9 | La Tania | €10,545 | +68% | 26 |
| 10 | Tignes - Val Claret | €12,424 | +66% | 83 |
Top 10 – Highest Priced
2025 completed salesSwipe the table to see all market indicators.
| Rank | Resort | €/m² SnowOnly Reference Price | 5-Year Change 2020–2025 | Completed Sales 2025 |
|---|---|---|---|---|
| 1 | Courchevel - Courchevel 1850 | €34,885 | +21% | 40 |
| 2 | Val d'isere | €28,761 | +49% | 91 |
| 3 | Meribel - Méribel Centre (1450) | €25,525 | +34% | 70 |
| 4 | Megeve | €18,959 | +39% | 241 |
| 5 | Courchevel - Courchevel Moriond (1650) | €16,923 | +43% | 30 |
| 6 | Courchevel | €16,701 | +24% | 50 |
| 7 | St Martin De Belleville | €16,302 | +93% | 20 |
| 8 | Tignes - Tignes Le Lac | €15,941 | +59% | 28 |
| 9 | Brévent | €15,333 | +26% | 118 |
| 10 | Chamonix | €15,214 | +40% | 182 |
Top 10 – Most Active
2025 completed salesSwipe the table to see all market indicators.
| Rank | Resort | €/m² SnowOnly Reference Price | 5-Year Change 2020–2025 | Completed Sales 2025 |
|---|---|---|---|---|
| 1 | Sallanches | €5,065 | +17% | 313 |
| 2 | Briançon | €4,911 | +36% | 291 |
| 3 | Val d’Allos | €4,160 | +39% | 264 |
| 4 | La Mongie | €3,159 | +25% | 245 |
| 5 | Megeve | €18,959 | +39% | 241 |
| 6 | Bagnères-de-luchon | €3,463 | +31% | 240 |
| 7 | Les Deux Alpes | €7,894 | +47% | 236 |
| 8 | Saint Gervais | €7,943 | +40% | 233 |
| 9 | La Faucille | €5,739 | +2% | 232 |
| 10 | Alpe d'Huez | €11,499 | +44% | 220 |
Based on completed sales in 2025, across all property types. Resorts need at least 10 sales to qualify. Five-year change is the change in the Reference Price per m², and a dash means the resort has no Reference Price for 2020 or 2025, so no change can be worked out. How to read these figures
How France’s ski resorts compare
The charts show each resort on its own, so you can see where one sits against the others before you open its market data.
Every resort: Reference Price and five-year change
Each dot is one resort with 10+ sales in 2025 and a Reference Price for 2020. Hover over a dot to see the resort, or click or tap it to open its market data. The list below the chart has every resort’s figures.
Scroll sideways to see the full chart.
List all 192 resorts in this chart
| Resort | Reference Price per m², 2025 | Change since 2020 | Completed sales, 2025 |
|---|---|---|---|
| Alpe d'Huez | €11,499 | +44% | 220 |
| Ancelle | €4,076 | +34% | 60 |
| Aragnouet | €3,173 | +9% | 27 |
| Argentiere - Chamonix | €10,570 | +18% | 33 |
| Auris | €4,771 | +48% | 34 |
| Aussois | €5,167 | +32% | 25 |
| Autrans-méaudre En Vercors | €5,219 | +26% | 57 |
| Avoriaz | €11,308 | +32% | 152 |
| Ax-les-Thermes | €3,312 | +14% | 82 |
| Bagnères-de-luchon | €3,463 | +31% | 240 |
| Barcelonnette | €3,521 | -7% | 90 |
| Barèges | €2,888 | +20% | 28 |
| Beaufort | €7,726 | +34% | 45 |
| Bellevaux-La Chèvrerie | €3,729 | +25% | 13 |
| Bernex | €5,484 | +20% | 34 |
| Besse-et-saint-anastaise | €3,672 | +6% | 127 |
| Beuil les Launes | €5,169 | +44% | 21 |
| Bisanne 1500 | €6,898 | +25% | 18 |
| Bogève | €4,053 | -13% | 18 |
| Bourg Saint Maurice | €6,517 | +63% | 126 |
| Bozel | €8,036 | +61% | 26 |
| Boëge | €5,824 | +33% | 25 |
| Briançon | €4,911 | +36% | 291 |
| Brides-les-bains | €6,080 | +38% | 60 |
| Brévent | €15,333 | +26% | 118 |
| Cauterets | €4,609 | +22% | 158 |
| Chamonix | €15,214 | +40% | 182 |
| Champagny | €8,190 | +20% | 34 |
| Chamrousse | €3,767 | +39% | 81 |
| Chatel | €7,725 | +18% | 127 |
| Chevry | €5,842 | +15% | 35 |
| Combloux | €9,600 | +25% | 101 |
| Cordon | €6,781 | +26% | 16 |
| Cornimont | €2,525 | +19% | 39 |
| Courchevel | €16,701 | +24% | 50 |
| Courchevel - Courchevel 1850 | €34,885 | +21% | 40 |
| Courchevel - Courchevel Le Praz (1330) | €13,683 | -17% | 18 |
| Courchevel - Courchevel Moriond (1650) | €16,923 | +43% | 30 |
| Crest-voland | €9,887 | +43% | 23 |
| Crozet | €9,042 | +55% | 24 |
| Demi-quartier | €11,583 | +4% | 47 |
| Domancy | €5,222 | -55% | 41 |
| Doucy/Celliers | €4,286 | +54% | 42 |
| Eaux-bonnes | €2,504 | +3% | 66 |
| Enchastrayes | €3,509 | +20% | 55 |
| Flaine | €6,339 | +24% | 111 |
| Flumet | €5,063 | -7% | 38 |
| Font-Romeu | €4,398 | +49% | 183 |
| Germ | €3,990 | +9% | 25 |
| Grand-aigueblanche | €4,432 | +24% | 69 |
| Gresse-en-vercors | €3,387 | +32% | 17 |
| Guillestre | €4,086 | +6% | 46 |
| Hirmentaz | €4,379 | +63% | 30 |
| Isola | €7,524 | +51% | 102 |
| La Bresse | €3,848 | +15% | 111 |
| La Clusaz | €11,306 | +13% | 101 |
| La Faucille | €5,739 | +2% | 232 |
| La Joue du Loup | €5,535 | +21% | 35 |
| La Mauselaine | €4,800 | +26% | 212 |
| La Meije | €6,231 | +58% | 13 |
| La Mongie | €3,159 | +26% | 245 |
| La Morte | €2,948 | +10% | 16 |
| Landry | €9,218 | +39% | 22 |
| Lanslevillard | €4,364 | +7% | 30 |
| La Plagne | €4,989 | +17% | 50 |
| La Plagne - Aime 2000 | €5,889 | +46% | 42 |
| La Plagne - Plagne 1800 | €8,541 | +50% | 100 |
| La Plagne - Plagne Bellecôte | €7,808 | +42% | 112 |
| La Rochette | €3,628 | +19% | 54 |
| La Rosiere | €12,015 | +106% | 50 |
| Laruns | €2,770 | +21% | 24 |
| La Tania | €10,545 | +68% | 26 |
| La Toussuire | €7,000 | +85% | 84 |
| Laveissière | €3,264 | +9% | 38 |
| Le Bettex | €9,323 | +34% | 35 |
| Le Bourg-d'oisans | €4,060 | +13% | 48 |
| Le Corbier | €3,314 | +41% | 114 |
| Le Grand-bornand | €8,254 | +17% | 145 |
| Le Monêtier-les-Bains | €7,795 | +27% | 51 |
| Le Pleynet | €2,806 | +27% | 24 |
| Les Angles | €5,301 | +34% | 129 |
| Les Arcs - Arc 1600 | €7,178 | +45% | 40 |
| Les Arcs - Arc 1800 | €12,458 | +88% | 117 |
| Les Arcs - Arc 1950 | €5,799 | +48% | 10 |
| Les Bottières | €3,052 | +15% | 15 |
| Les Carroz d'Arâches | €8,153 | +25% | 99 |
| Les Coches | €5,571 | +3% | 19 |
| Les Contamines-montjoie | €8,180 | +31% | 63 |
| Les Deux Alpes | €7,894 | +47% | 236 |
| Les Gets | €10,000 | +7% | 174 |
| Les Habères | €5,268 | +32% | 58 |
| Les Houches | €11,867 | +58% | 126 |
| Les Menuires | €9,042 | +45% | 96 |
| Les Orres | €4,254 | +39% | 99 |
| Les saisies | €9,192 | +25% | 75 |
| Les Tuffes | €4,798 | +28% | 113 |
| Lugrin | €5,674 | +14% | 44 |
| Luz-saint-sauveur | €3,393 | +21% | 41 |
| Lélex | €2,773 | +17% | 18 |
| Magland | €4,399 | +9% | 38 |
| Manigod | €8,357 | +23% | 59 |
| Megeve | €18,959 | +39% | 241 |
| Meribel - Les Allues | €11,376 | +35% | 24 |
| Meribel - Méribel-Mottaret (1750) | €14,292 | +41% | 48 |
| Meribel - Méribel Centre (1450) | €25,525 | +34% | 70 |
| Mieussy | €6,425 | +30% | 42 |
| Mijoux | €3,430 | +37% | 24 |
| Modane | €3,472 | +22% | 115 |
| Montalbert | €6,710 | +26% | 95 |
| Montchavin | €6,086 | +45% | 23 |
| Montgenevre | €7,537 | +33% | 70 |
| Montriond | €11,852 | 0% | 44 |
| Morillon | €5,394 | +14% | 102 |
| Morzine | €10,390 | +11% | 161 |
| Moûtiers | €3,173 | +33% | 87 |
| Notre-Dame-de-Bellecombe | €6,923 | +31% | 54 |
| Noyarey | €5,539 | +62% | 41 |
| Onnion | €7,082 | +79% | 27 |
| Orcières | €3,821 | +48% | 94 |
| Orelle | €4,452 | +75% | 28 |
| Oz | €6,515 | +16% | 12 |
| Passy | €5,768 | +40% | 140 |
| Peisey-Vallandry | €9,221 | +86% | 42 |
| Pipay | €4,696 | -8% | 13 |
| Pralognan-la-vanoise | €6,753 | +17% | 51 |
| Pra Loup | €4,263 | +19% | 162 |
| Prapoutel | €4,885 | +26% | 57 |
| Praz de Lys | €6,256 | +24% | 104 |
| Praz sur arly | €7,209 | +23% | 77 |
| Puy-saint-vincent | €4,097 | +46% | 93 |
| Puy de Sancy | €3,580 | +3% | 105 |
| Pyrénées 2000 | €5,588 | +41% | 103 |
| Reberty Villages | €8,827 | +15% | 22 |
| Risoul | €5,511 | +28% | 128 |
| Saint-chaffrey | €7,356 | +31% | 106 |
| Saint-genis-pouilly | €6,166 | +7% | 171 |
| Saint-jean-de-maurienne | €3,449 | +30% | 104 |
| Saint-jean-de-sixt | €7,626 | +17% | 47 |
| Saint-jeoire | €4,846 | +21% | 53 |
| Saint-lary-soulan | €4,749 | +29% | 162 |
| Saint-léger-les-mélèzes | €2,854 | +26% | 20 |
| Saint-mamet | €3,886 | +26% | 26 |
| Saint-martin-d'uriage | €4,593 | -2% | 55 |
| Saint-martin-vésubie | €3,644 | -4% | 44 |
| Saint-michel-de-maurienne | €3,917 | +118% | 27 |
| Saint-Étienne-de-tinée | €9,428 | +53% | 109 |
| Sainte-foy-tarentaise | €10,471 | +26% | 26 |
| Saint Gervais | €7,943 | +40% | 233 |
| Sallanches | €5,065 | +17% | 313 |
| Samoens | €7,140 | +16% | 149 |
| Sergy | €5,347 | -3% | 21 |
| Serre Chevalier | €6,364 | +30% | 44 |
| Servoz | €10,671 | +57% | 25 |
| Sixt | €7,247 | +60% | 14 |
| St. Jean d'Aulps-La Grande Terche | €5,748 | +34% | 127 |
| St François Longchamp | €4,686 | +20% | 98 |
| St Jean d’Arves | €4,071 | +39% | 33 |
| St Martin De Belleville | €16,302 | +93% | 20 |
| St Sorlin | €4,739 | -2% | 57 |
| Superdévoluy | €3,764 | +13% | 135 |
| Séez | €5,088 | +29% | 30 |
| Termignon | €6,153 | +34% | 34 |
| Thollon-les-Mémises | €4,669 | +27% | 68 |
| Thônes | €6,318 | +24% | 83 |
| Tignes - Lavachet | €12,060 | +40% | 39 |
| Tignes - Tignes Le Lac | €15,941 | +59% | 28 |
| Tignes - Val Claret | €12,424 | +66% | 83 |
| Ustou | €2,455 | -5% | 24 |
| Valberg | €7,649 | +49% | 88 |
| Val d'isere | €28,761 | +49% | 91 |
| Val d'isere - La Daille | €13,339 | +20% | 29 |
| Valdeblore | €5,373 | +36% | 36 |
| Val d’Allos | €4,160 | +39% | 264 |
| Valloire | €7,403 | +40% | 91 |
| Vallorcine | €12,124 | +34% | 13 |
| Vallouise | €4,510 | +26% | 49 |
| Valmeinier | €5,683 | +17% | 61 |
| Valmorel | €6,792 | +48% | 81 |
| Val Thorens | €14,093 | +45% | 196 |
| Vars | €5,431 | +14% | 139 |
| Vaulnaveys-le-haut | €4,855 | +21% | 41 |
| Ventron | €3,678 | +56% | 18 |
| Verchaix | €7,234 | +16% | 22 |
| Vielle-aure | €3,950 | +19% | 21 |
| Villard-de-lans | €5,234 | +28% | 213 |
| Villard-de-Lans Corrençon-en-Vercors | €6,683 | +44% | 17 |
| Villard-sur-doron | €8,849 | +23% | 27 |
| Villarodin-bourget | €3,710 | +15% | 35 |
| Villeneuve-la-Salle | €6,699 | +23% | 69 |
| Viuz-en-sallaz | €4,978 | +7% | 55 |
| Xonrupt-longemer | €4,809 | +26% | 52 |
| Échenevex | €6,391 | -15% | 45 |
Completed sales by year
Apartments and houses across the resorts we track.
Each point is the number of completed sales in that year. The line shows how sales activity has changed, across all the resorts we track.
No completed sales are available for these years.
Resorts by Reference Price per m², 2025
How many of the 192 resorts fall in each price band.
Each bar counts resorts in that Reference Price band. Reference Price marks the upper end of completed sales, rather than the average property price.
No resorts meet the data requirements.
How to read the France ski property market data
Every figure on this page comes from completed sales recorded in DVF, France’s official register of property sales, published by the tax authority. Each resort page breaks the same figures down by property type, size and month.
- SnowOnly Reference Price per m² (€/m²)
- The price per m² at which the top 10% of a resort’s completed sales begin. It marks the upper end of each market, so most homes in a resort sold for less. It is worked out the same way in every resort, which makes it a fair way to compare them, and it is the price used in the rankings.
- 5-Year Change
- How far the Reference Price per m² has moved between 2020 and 2025. A dash means the resort has no Reference Price for 2020 or 2025, so no change can be worked out.
- Completed Sales
- The number of apartment and house sales registered in the year. More sales mean a more liquid market and a steadier price figure, so a resort needs at least 10 to appear in the rankings.
Figures cover all property types and are updated after each release of the official sales data, in spring and autumn. Sales take a few months to reach the register, so the latest complete year is shown.
What you’ll find on each resort page
Choose a resort above to see its full market data. Compare two resorts and you’ll see the same figures side by side.
- The Reference Price per m², the full sale price at the same top-10% point, and how both have changed since 2020
- Completed sales month by month, so you can see the busy and quiet seasons
- Prices by size and number of rooms, for apartments and houses
- How prices are spread across the market, from entry level to the top end
- Recent completed sales in the resort
Why compare resorts?
In 2025, the Reference Price per m² ran from €2,455 in Ustou to €34,885 in Courchevel - Courchevel 1850, and villages within the same resort can differ widely.
Comparing two resorts side by side shows how far apart they are on price, five-year change and number of sales, before you look at a property in either.