EUR 4,160,000
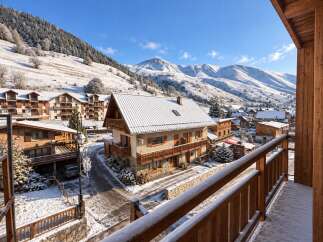
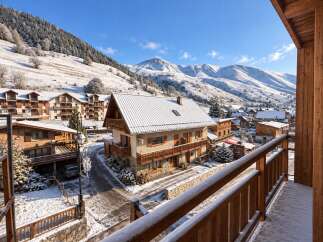
Chalet for sale in Rhone Alps with 6 Beds
La Toussuire, France
St Sorlin's SnowOnly Reference Price was €4,739 per square metre in 2025, unchanged on 2024, 19.7% below the 2021 peak of €5,903. In the 12 months to June 2026 it was €4,790, 0.5% above the €4,767 of the 12 months before, on 58 sales against 50. The 2025 figure puts St Sorlin in the middle range of French ski resorts.
The 2021 figure stands alone; in the years since, the level has stayed between €4,073 and €4,739. Apartments, 49 of the 57 sales in 2025, rose 4.9% to €4,310 over the 12 months to June 2026. In 2025 St Sorlin sat 32.3% below La Toussuire and 16.4% above St Jean d'Arves.
The SnowOnly view: 2021 looks like a single high year, and the price has held steady since, about a third below La Toussuire.
You can also compare this market data for St Sorlin with another ski resort. Choose a resort to compare.
This section summarises the core numbers that define the local property market at a glance, including typical prices, how active the market is, and how values have changed over time. It helps you quickly judge affordability, demand, and longer-term price direction before diving into more detailed charts.
This chart shows the range of actual sale prices achieved each year, not asking or reservation prices. It reflects what buyers really paid when transactions completed.
How to read the lines:It shows real market behaviour, helping you assess fair value, set realistic expectations, and understand where a property sits compared with what buyers actually paid.
This chart shows the SnowOnly Reference Price per square metre achieved each year — the level the top tenth of completed sales reached or exceeded (not asking prices). Because it's measured per square metre, it helps you compare across different property sizes. Use it to spot the longer-term direction of the upper market, and to sense-check whether a quoted price per square metre for a premium property looks high or low versus recent years.
This chart shows the number of completed property sales by month, based on the filters you've selected such as property type, size, and time period. It helps you understand how active the market is, spot seasonal patterns, and judge how competitive conditions may be when buying and negotiating.
These charts break the market down by size,
room count  , and property type to show how prices
and supply differ across common buyer choices. They help you compare like-for-like
properties, understand what drives price differences, and narrow your search to options that
best match your budget and requirements.
This table shows a list of 10 recent completed property sales, including size, room count, total price, and price per square meter. It helps you see real-world prices for comparable properties, making it easier to judge value, assess asking prices, and negotiate with confidence.
| Date | Type | Address | Nom Commune | Size |
Rooms
|
Total Price |
|---|---|---|---|---|---|---|
| Jun 2026 | Apartment | Che Des Bergers | Saint-Sorlin-D Arves | 38m² | 3 | €130,000 |
| Jun 2026 | Apartment | Che Du Crou | Saint-Sorlin-D Arves | 28m² | 2 | €116,600 |
| Jun 2026 | Apartment | Rte Du Col De La Croix De Fer | Saint-Sorlin-D Arves | 43m² | 3 |
€184,800
|
| Jun 2026 | Apartment | Che De La Cliant | Saint-Sorlin-D Arves | 29m² | 2 | €122,920 |
| Jun 2026 | Apartment | Che De Cufferent | Saint-Sorlin-D Arves | 35m² | 3 | €143,000 |
| Jun 2026 | Apartment | Che Des Fermes | Saint-Sorlin-D Arves | 32m² | 3 | €62,000 |
| May 2026 | Apartment | Che Des Fermes | Saint-Sorlin-D Arves | 32m² | 3 | €86,000 |
| May 2026 | Apartment | Rte Du Col De La Croix De Fer | Saint-Sorlin-D Arves | 30m² | 1 |
€87,400
|
| May 2026 | Apartment | Che Du Crou | Saint-Sorlin-D Arves | 35m² | 2 | €134,500 |
| May 2026 | Apartment | Che De La Cliant | Saint-Sorlin-D Arves | 68m² | 5 | €315,600 |
These are the other resorts within the same connected ski area, so you can compare nearby markets that share the same slopes and lift access.
Transaction dates shown reflect contract signing dates from French government data. Actual property completions typically occur 4–8 weeks later.